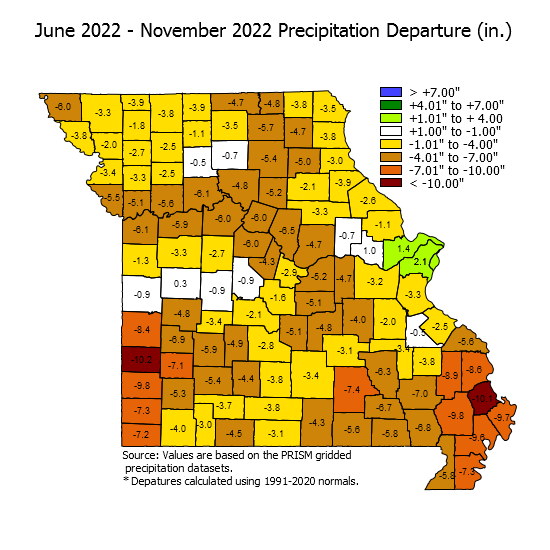
Missouri County Precipitation Departure From Normal*
For June 2022 to November 2022
Pat Guinan
Extension Associate Professor in Climatology
Commercial Agriculture/University of Missouri Extension
February 8, 2023
1-Month Map 3-Month Map 6-Month Map 12-Month Map
Please contact agebb@missouri.edu
for higher resolution maps for printing purposes.
| Departure from Long-term Average For June 2022 to November 2022* | |||
|---|---|---|---|
| County | Total (in.) | County | Total (in.) |
| Adair | -5.74 | Linn | -0.74 |
| Andrew | -1.98 | Livingston | -0.48 |
| Atchison | -6.00 | Macon | -5.40 |
| Audrain | -3.30 | Madison | -3.79 |
| Barry | -3.95 | Maries | -5.07 |
| Barton | -10.24 | Marion | -3.04 |
| Bates | -0.86 | McDonald | -7.16 |
| Benton | -0.87 | Mercer | -3.92 |
| Bollinger | -8.86 | Miller | -1.62 |
| Boone | -6.54 | Mississippi | -9.66 |
| Buchanan | -3.37 | Moniteau | -4.31 |
| Butler | -6.83 | Monroe | -2.13 |
| Caldwell | -2.46 | Montgomery | -0.71 |
| Callaway | -4.66 | Morgan | -0.91 |
| Camden | -2.13 | New Madrid | -9.55 |
| Cape Girardeau | -8.59 | Newton | -7.25 |
| Carroll | -6.06 | Nodaway | -3.30 |
| Carter | -6.66 | Oregon | -5.59 |
| Cass | -1.32 | Osage | -5.17 |
| Cedar | -6.91 | Ozark | -3.08 |
| Chariton | -4.83 | Pemiscot | -7.25 |
| Christian | -3.66 | Perry | -5.60 |
| Clark | -3.54 | Pettis | -2.71 |
| Clay | -5.08 | Phelps | -4.83 |
| Clinton | -3.28 | Pike | -2.61 |
| Cole | -2.89 | Platte | -5.47 |
| Cooper | -5.99 | Polk | -5.87 |
| Crawford | -4.04 | Pulaski | -5.09 |
| Dade | -7.07 | Putnam | -4.73 |
| Dallas | -4.93 | Ralls | -3.93 |
| Daviess | -2.54 | Randolph | -5.16 |
| DeKalb | -2.69 | Ray | -5.58 |
| Dent | -3.08 | Reynolds | -6.34 |
| Douglas | -3.80 | Ripley | -5.80 |
| Dunklin | -5.76 | Saline | -6.00 |
| Franklin | -3.17 | Schuyler | -4.75 |
| Gasconade | -4.70 | Scotland | -3.84 |
| Gentry | -1.80 | Scott | -10.11 |
| Greene | -5.40 | Shannon | -7.39 |
| Grundy | -1.09 | Shelby | -5.05 |
| Harrison | -3.77 | St. Charles | +1.39 |
| Henry | +0.31 | St. Clair | -4.78 |
| Hickory | -3.41 | St. Francois | -0.50 |
| Holt | -3.80 | St. Louis | +2.09 |
| Howard | -6.05 | Ste. Genevieve | -2.49 |
| Howell | -4.30 | Stoddard | -9.78 |
| Iron | -3.43 | Stone | -2.97 |
| Jackson | -6.13 | Sullivan | -3.50 |
| Jasper | -9.77 | Taney | -4.52 |
| Jefferson | -3.26 | Texas | -3.44 |
| Johnson | -3.31 | Vernon | -8.45 |
| Knox | -4.65 | Warren | +0.99 |
| Laclede | -2.84 | Washington | -1.98 |
| Lafayette | -5.92 | Wayne | -6.99 |
| Lawrence | -5.30 | Webster | -4.44 |
| Lewis | -3.78 | Worth | -3.87 |
| Lincoln | -1.15 | Wright | -3.78 |
For more information, please visit: www.prism.oregonstate.edu/
* Daily gridded data was used to generate the monthly averages.
The period used was 1991 to 2020.
Values were generated using ACIS gridded data.
Areal value is calculated by weighting the grid cells by area within the county.
[ Missouri Agricultural Weather ]
[ MU Drought site ]

College of Agriculture Food and Natural Resources
Site maintained by people at AgEBB
agebb@missouri.edu
University of Missouri Extension does not discriminate on the basis of race, color, national origin, sex, religion, age, disability or status as a Vietnam-era veteran in employment or programs.