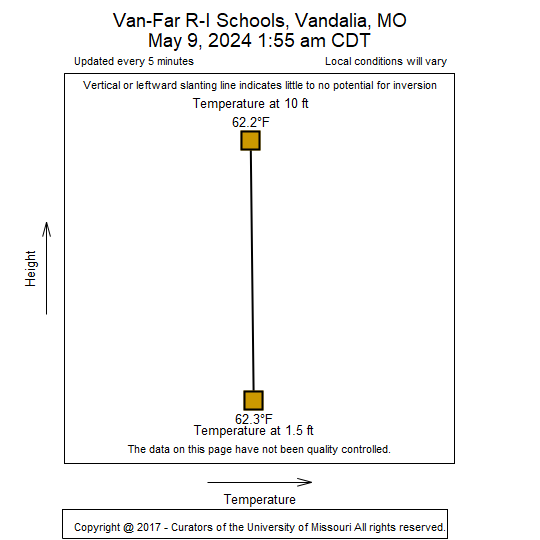
Real-Time Temperature Monitoring for Inversion Potential at Vandalia, MO

Graph Description:
Little to No Inversion Potential:
line is vertical or slants leftward, i.e. | or \
Inversion Potential:
line slants rightward, i.e. /
(The more the line leans rightward, the greater the potential for inversion existing)
American Meteorological Society definition of
Temperature Inversion
Research funded by Missouri Soybean Merchandising Council
Disclaimer
The data on this page has not been quality controlled, and local conditions will vary.
Any scientific measurement is reliable up to specfic levels of accuracy. To see temperature sensor specifications, please visit: https://www.campbellsci.com/hmp60#specifications_
