January 2004
University of Missouri and Paragon Economics*
![]()
The January data for hog marketing arrangements or marketing contracts in the
mandatory price reporting information was summarized.
The definitions for the marketing arrangements in this study are not the same as t
hose used in other studies conducted by the University of Missouri and the National
Pork Board. In fact, since our first study using mandatory price reporting data
was conducted in 2002, two of the mandatory price definitions have changed.
Although direct comparison for all marketing arrangements cannot be made across
all the years of our studies, we believe the spot market or negotiated groups are
directly comparable through all of our studies since 1994.
Here are the current definitions of the arrangements reported under the mandatory
price reporting system and the changes affecting comparisons of data with earlier
studies:
Total hog slaughter under Federal Inspection in January 2004 was 8,697,902 head.
Data for 8,034,924 head (92.4% of FI slaughter) are included in the mandatory
price reporting system.
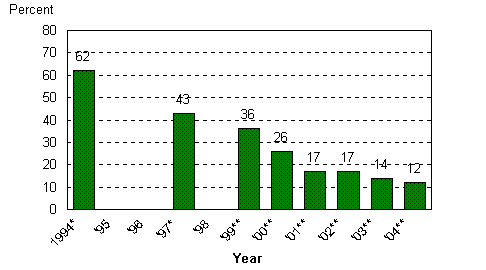
Non-negotiated or non-spot purchases in January 2004 accounted for 88.4% of the
purchases of market hogs included in the mandatory price reporting data. The 2003
study showed 86.5%; the 2002 study showed 83.3%; the 2001 study showed 82.7%; the
2000 study showed 74.3%; the 1999 study showed 64.2%; and the 1997 study showed
56.6% were non-negotiated transactions.
Figure 1.
*University of Missouri, Pork magazine, PIC, DeKalb Choice Genetics,
By adding the percentage of hogs purchased in the negotiated markets to the
percentage purchased on a swine-pork market formula, the current study indicates
that the price of at least 53% of the hogs in the U.S. was directly determined
by the negotiated market. The true percent is higher because a high percentage
of the packer-owned and packer-sold hogs are priced with a market formula.
About 27.8% of the hogs in 2004 were purchased under some system that supposedly
reduces price risk to producers, 7.2% were bought on a contract tied to the
futures market, and 20.6% were other purchase arrangements. These price shifting
arrangements amounted to 34.4% of the independently produced hogs.
"Supposedly" is used in the paragraph above because some of the pricing systems
do not actually affect the variance of price received by the producers. Only cash
contracts (the ones usually tied to futures) and contracts without ledgers reduce
producers' price risk. Other arrangements may or may not result in a realized
average price that is different from the actual average negotiated price.
The data in the mandatory price reports do not permit one to quantify how many l
edger arrangements there are. Any amount by which the market price falls short
of the arrangement's lower critical price must be repaid in at least a portion
of ledger contracts. Some of the contracts contain a sunset clause to end after
a specified time period. We do have data on ledgers and other characteristics
for the other purchase arrangement hogs from a 2003 University of Missouri
unpublished study. Based on this data, for 77% of the other purchase arrangement
hogs the price is tied to feed prices and for 23% the contract is a window type.
The ledger contracts amount to 61% of the other purchase arrangement hogs and
39% of these hogs have no ledger.
The continued decline in the negotiated or spot market hogs increases the urgency
for the industry to find another form of price discovery for most of the contracts.
One possibility is to have mandatory price reporting of meat and tie the contracts
to meat prices.
The mandatory price reporting legislation also required packers to report percent
lean, carcass weight, base price, and net price for each marketing arrangement
type. These data for January 2004 appear in Table 2.
The negotiated hogs had the second lowest percent lean, the lightest average
weight, and the lowest net carcass price. The other market formula hogs had a
percent lean close to the negotiated hogs. The other market formula hogs had
the highest average carcass weight at 205.54 pounds.
The other purchase arrangement hogs had the second highest net price. This was
probably due to the generally low price for hogs during January of 2004. We
believe this group of hogs will likely have the lowest average price for those
months when the negotiated market price is unusually high.
Percent of U.S. Hogs Sold Through Various Pricing Arrangements,
January 1999-2004*
Hog or meat market formula
Other market
formula
Other purchase
arrangement
Packer-sold
Packer-owned
Negotiated -
spot
*2002, 2003, and 2004 data based on USDA Mandatory Reports,
1999-2001 based on industry survey.
Percent of Hogs Sold on the Negotiated Market

National Pork Producers Council, Land O'Lakes studies.
** University of Missouri, NPPC, National Pork Board studies. '02 - '04 USDA/NASS data.
Hog Marketing Arrangements,
January 2004
Negotiated
Swine-pork market formula
Other market formula
Other purchase arrangement
Packer-sold
Packer-owned
*Net price includes credits for quality, transportation, time of delivery, etc.
*Glenn Grimes, Professor Emeritus, and Ron Plain, Professor, University of
Missouri; and Steve Meyer, President of Paragon Economics. The study was funded
by the University of Missouri and the National Pork Board.
![]()